Search analytics
What analytics shows
Every search your storefront makes with a saved search profile is logged: the query, how many products it found, how long it took, which filters it used and which ranking rules fired. When your store also sends events, each click, add-to-cart and purchase is tied to the search that led to it. Analytics adds all of that up per index.
Open the analytics page
Open an index and click Analytics in the menu, under Test & measure. Any member of the project can read it.
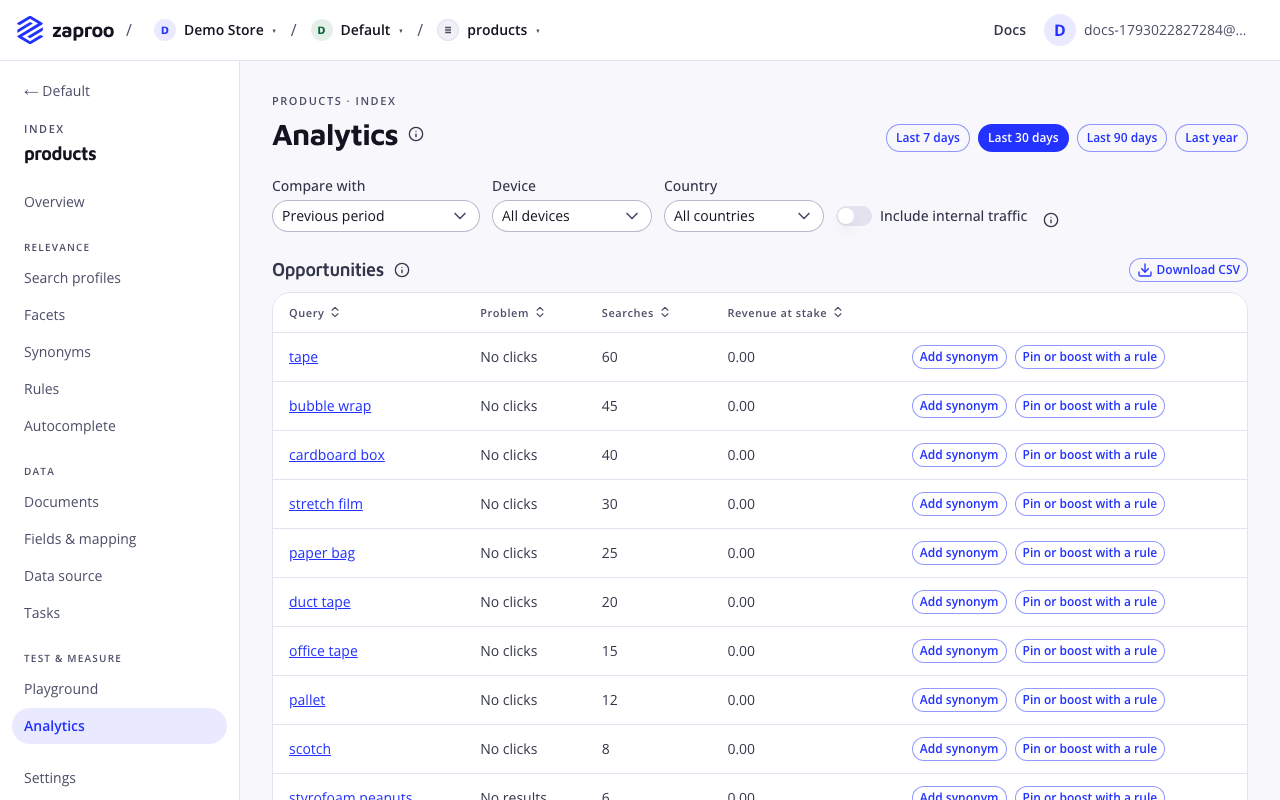
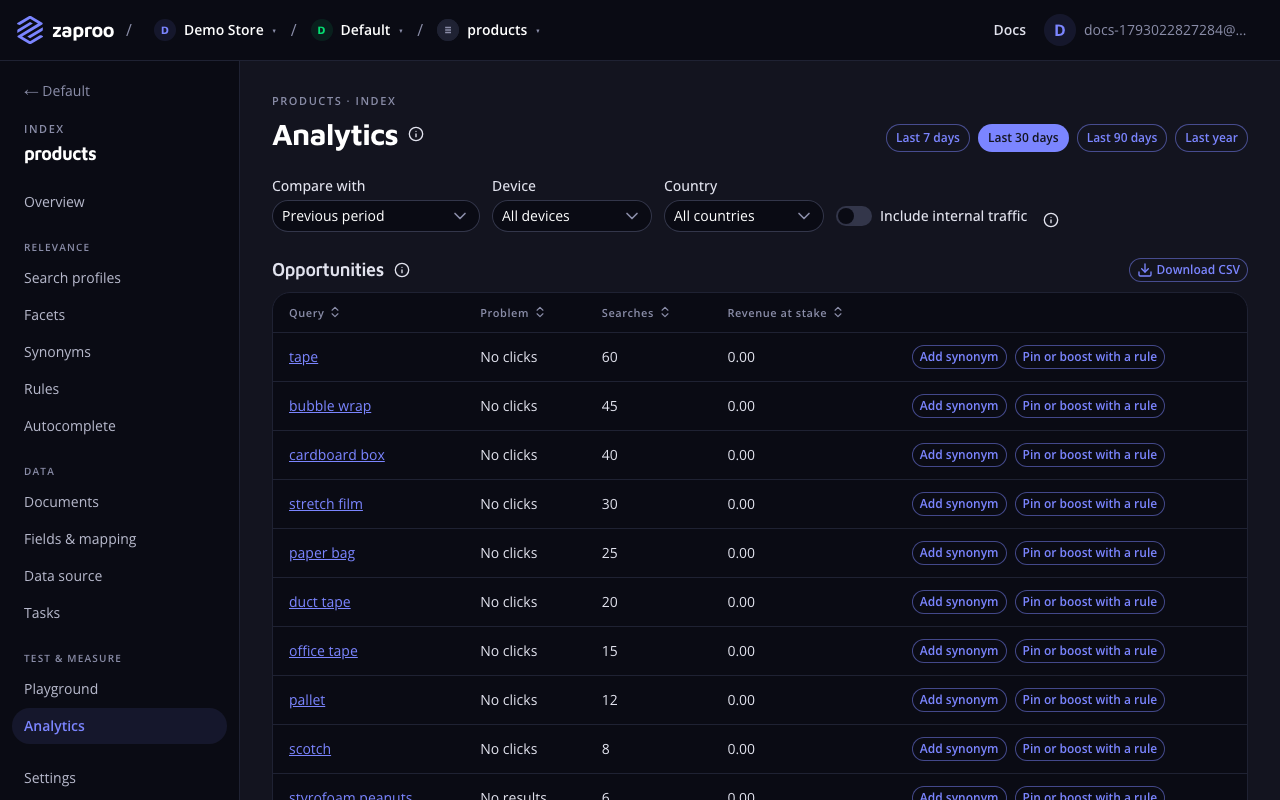 Analytics for the last 30 days, opportunities first
The page has, from top to bottom:
- The window and the filters. See Window, comparison and filters.
- Opportunities: the queries that cost you the most, each with Add synonym and Pin or boost with a rule.
- The headline numbers, each with its change against the comparison window.
- Searches over time, the timeline, with the searches that found nothing in red.
- A tab per report: Queries, No clicks, Products, Click positions, Filters, Autocomplete, Rules and Refinements. Each table has Download CSV.
Click any query in a table to open it on its own: searches per day, the synonyms and rules that touched it, and the numbers before and after the latest fix. See One query.
If your store sends no events yet, the page shows No clicks, carts or purchases yet. Searches are still counted, but click-through, conversion, revenue and the opportunities list stay empty until you send events.
New searches show up within a few seconds. To check the page right after setup, run a few searches from your storefront, not from the cabinet: cabinet searches are left out unless you turn on Include internal traffic.
Window, comparison and filters
Pick Last 7 days, Last 30 days, Last 90 days or Last year at the top. The window always ends now.
Compare with sets the comparison window: Previous period (the default), Same period last year or No comparison. Every headline number then shows its change, and the Queries report gets a Before column.
Device and Country narrow every number on the page to one device class (desktop, mobile or tablet, read from the user agent) or one country. The country comes from the cf-ipcountry header your CDN sets, so it is empty when there is no CDN in front of the API.
Include internal traffic adds the searches and events that are normally left out. See the next section.
What counts as real traffic
Every logged search and event carries a source. Reports count only live unless you turn on Include internal traffic (includeInternal=true on the API).
| Source | What it is |
|---|---|
live | A shopper on your store. The only source the reports count by default. |
cabinet | A signed-in user: the playground, the profile and rule editors. |
mcp | An AI agent calling the search tool. |
opted_out | A search sent with analytics: false. See Opting a search out. |
excluded_ip | A request from one of the project's excluded IP addresses. |
bot | A request whose user agent is a known crawler. |
The source is decided once, when the search or event is logged, in that order: an opted-out search stays opted_out even when it comes from an excluded address.
Two more rules keep the counts honest:
- Search-as-you-type is collapsed. When one session sends "bub", "bubb" and "bubble wrap" within a few seconds, only the last one counts. The earlier keystrokes are marked
supersededand left out of every report. - Retypes are remembered. When a search finds nothing and the same session searches for something else within 60 seconds, the second search records the first as
refinedFrom. That feeds the Refinements report.
Excluded IP addresses
Searches and events from these addresses are logged as excluded_ip and left out of the reports and of autocomplete. Use the list for your office, your test scripts and your staging server.
- Open the project and click Settings in the project menu.
- Under Excluded IP addresses, enter one IPv4 or IPv6 address or CIDR range per line, up to 50. For example
203.0.113.7or198.51.100.0/24. - Click Save.
The list applies to every index of the project from the next search. Only organization owners and admins can change it. A line that is not an address or a range is listed under Check the list, and nothing is saved until you fix it.
With the API, send the whole list on the project update route:
PUT/v1/projects/:projectIdAdmin or owner of the organizationcurl -X PUT https://api.search.zaproo.cloud/v1/projects/$PROJECT_ID \
-H "Authorization: Bearer $ACCESS_TOKEN" -H "Content-Type: application/json" \
-d '{"analyticsExcludedIps": ["203.0.113.7", "198.51.100.0/24"]}'
Opting a search out
Send "analytics": false in the search request body and the search is served as usual but logged as opted_out. Use it for synthetic traffic you control: uptime checks, load tests, a demo page. The home page demo on this site sends it. Events have no such flag; an event is tied to its search, and takes the source of the request that sends it.
{ "q": "bubble wrap", "analytics": false }
Headline numbers
The cabinet shows them as tiles: Searches, Sessions with search, Zero-result rate, Click-through rate, Add-to-cart rate, Conversion rate, Search revenue, Share of revenue, Average click position, Latency p50 and Latency p95. The info button on each tile opens its definition from this page. The names in code are the API fields.
Rates are shares of distinct searches, from 0 to 1; the cabinet shows them as percentages. Every number comes with its value over the comparison window, null when there is no comparison or nothing to divide by.
Searches and sessions
searches: logged searches in the window, the empty query included (a shopper browsing a category without typing). Keystroke searches that a later one superseded are not counted. sessions: distinct sessions that made at least one search, from the sessionId your storefront sends. Without session ids it stays at zero.
Zero-result rate
zeroResultRate: the share of searches that found nothing. It is the first number to watch after a change to a profile, synonyms or rules. A popular zero-result query matters more than twenty that were searched once, so work through the Opportunities list rather than the rate.
Click-through rate
ctr: searches with at least one click, divided by searches. It needs click events. A low rate with a low zero-result rate means the results are there but not convincing: check the ranking, the titles and the images.
Add-to-cart and conversion rate
addToCartRate: searches followed by an add-to-cart event, divided by searches. conversionRate: searches followed by a purchase, divided by searches. Both need the matching events.
Search revenue and its share
revenue: the sum of quantity × price over every purchase line tied to a search in the window, in the currency your events send. revenueShare: that revenue divided by the revenue of every purchase event you sent, tied to a search or not. Send every order, not only the ones that came from search, or the share is meaningless.
Average click position
avgClickPosition: the mean position of clicked results, from 1. Rising means shoppers scroll further before they find what they want.
Latency
latencyP50 and latencyP95: the time the search took inside Zaproo, in milliseconds, for the median search and for the slowest 5 percent. Network time to your server is not included.
Timeline
Searches over time draws one bar per bucket. The red part of each bar is the searches that found nothing. Point at a bar to see its date and counts.
In the API answer, timeline holds one bucket per hour when the window is two days or shorter, and one per day when it is longer. Every bucket has ts (its start), searches, zeroResults, clicks and revenue. Buckets without traffic are included with zeros, so the series has no gaps.
With the API
Everything the page shows comes from one route. Use it to pull the numbers into your own reports.
GET/v1/projects/:projectId/indices/:indexId/analyticsProject member or any secret keycurl "https://api.search.zaproo.cloud/v1/projects/$PROJECT_ID/indices/$INDEX_ID/analytics?from=2026-10-01T00:00:00Z&to=2026-10-15T00:00:00Z&compare=previous&device=mobile" \
-H "Authorization: Bearer $ZS_KEY"
How did search do last week compared with the week before? Mobile only.
The agent calls get_search_analytics, which takes the same parameters.
| Parameter | Meaning |
|---|---|
from, to | ISO timestamps. Leave both out for the last 30 days up to now. from must be before to, and the window may span at most the retention. |
compare | previous (default), year or none. |
device | desktop, mobile or tablet. |
country | An ISO 3166-1 alpha-2 code, DE. |
includeInternal | true to count every source, not only live. |
The answer holds kpis (every headline number as { value, previous }), previous (the comparison window), timeline, devices and countries (searches per device and per country, for the filters), and topQueries and zeroResultQueries (the 50 most searched queries, and the 50 most searched that found nothing). A window longer than the retention answers 400 VALIDATION_FAILED.
Retention
Zaproo keeps the search log and the events for 760 days by default, so a 12-month window can be compared with the year before. Zaproo staff can set the value between 30 and 1825 days for the whole platform. The longest window the API accepts equals the retention. Data rolls over monthly, so a record is deleted within about a month after it passes the retention, not on the day.
Weekly digest and alerts
Every Monday at 07:00 UTC, the owners and admins of the organization get one email per project that had searches last week: the headline numbers against the week before, the top five opportunities and the top five products, with links into the cabinet. To turn it off for a project, open the project's Settings, switch off Email a weekly digest to owners and admins and click Save. With the API, send "analyticsDigest": false on the project update route.
Alerts are checked every morning at 06:00 UTC against the day before. Each project gets at most one per type and day, and the digest switch turns them off too:
- the zero-result rate rose by half and by at least 5 points against the previous 4 weeks;
- searches fell by 60 percent against the same weekday of the previous 4 weeks;
- the click-through rate fell by 40 percent.
Each one needs at least 200 searches in the baseline, so a quiet index does not alert on noise.
What gets logged
- Searches with a saved profile, on the public route
POST /v1/search/:profileKeyand on the secret route by index id. - Not logged: searches with an inline profile (the profile editor's preview,
preview_profileandtest_ruleover MCP), and autocomplete requests. Autocomplete analytics come fromsuggestion_clickevents. - With each search: the query, the result count, the latency, the device class and country, the filter fields and, for keyword and boolean filters, their values. A
sessionIdis stored as a salted hash. - Records reach analytics within a few seconds.
Common mistakes
- Reading the rates right after launch. A few hundred searches make a noisy rate. Judge a change over a week of traffic.
- Counting your own traffic. Add your office and your test servers to the excluded IPs, and send
analytics: falsefrom scripts. - Sending only some orders. The share of revenue compares search orders with all orders. Send every purchase.
- Searching without a session id. Without
sessionId, sessions stay at zero, keystrokes are not collapsed, and an event without asearchIdcannot fall back to the session's last search.
Related
Autocomplete
Set up query suggestions in the cabinet. They are built every hour from your shoppers' searches, field values and custom entries.
Reports
Every analytics report with the definition of each column, the opportunities list and its fix buttons, the per-query view with before and after, and the CSV download.